Statistical Mayhem: Building the Foundation
The best (or worst) thing about trying to dive deeper into subjects after college is that you may realize that passing a class is very different from actually understanding the subject (though not incompatible).
This morning I had a wait moment (kind of like DeepSeek) regarding statistics. Thus, I (and you alongside with me) will try to develop a deeper understanding of some fundamental concepts.

Let’s start with one if not the most important concept in statistics: Expected Value
Expected Value: The random variable’s center of gravity
Expected value is a bit of a tricky one due to its simplicity… I mean this line on its Wikipedia article sums it up pretty well: “Informally, the expected value is the mean of the possible values a random variable can take”.
We will start with a quick reminder of the formulas. Given a random variable $X$:
- If $X$ is discrete, we define its expected value to be $$ \begin{equation} \mathbb{E}[X] = \sum_{x_i \in \Omega}{x_i\mathbb{P}[X = x_i]} \end{equation} $$
- If $X$ is continuous, we define its expected value to be $$ \begin{equation} \mathbb{E}[X] = \int_{\Omega}{x f(x)\, dx} \end{equation} $$
These definitions are not fully rigorous, but they are sufficient for our purposes here.
Under the hood they both convey the same idea. To find the expected value of something you need to take the weighted average of this something, that is the sum of all possible values of this something, each multiplied by their probability of realisation.
Rather than using the usual dice example, which most of us are familiar with, I’ll take a more visual approach.
Let’s modify our initial formula $(1)$ a bit by taking $\bold{X} = (X_1, X_2)$ instead of just $X$:
$$ \mathbb{E}[\bold{X}] = \sum_{(x_i, y_i) \in \Omega}{(x_i, y_i)\mathbb{P}[\bold{X} = (x_i, y_i)]} $$Furthermore, we set $\Omega = {(1, 1), (1, -1), (-1, 1), (-1, -1)}$.
Uniform distribution: The base case
Say that $\Omega$ follows a uniform distribution.
Computing its expected value
$$ \mathbb{E}[\bold{X}] = \frac{1}{4} \times [(1, 1) + (1, -1) + (-1, 1) + (-1, -1)] = (0, 0) $$we find that the expected value of $\bold{X}$ is the origin of the plane.
We will place these points on a plane and see how their center of gravity evolves. To better illustrate what I mean, I displayed the changing probability of each point (as we gradually add points which follow a uniform distribution) as the weight.
See what is going on ? What happens if we adjust the probabilities, effectively shifting the ‘mass’ of the distribution?
From uniform to non-uniform:
Let’s now remove the uniform distribution and say that we now have the following probability distribution:
$$ \mathbb{P}[\bold{X} = (x_i, y_i)] = \begin{cases} \frac{5}{8}, & \text{if } (x_i, y_i) = (-1, -1) \\ \frac{1}{8}, & \text{otherwise} \end{cases} $$Computing
$$ \mathbb{E}[\bold{X}] = \frac{1}{8} \times [(1, 1) + (1, -1) + (-1, 1)] + \frac{5}{8} \times (-1, -1) = (-\frac{1}{2}, -\frac{1}{2}) $$we find that the expected value of $\bold{X}$ is the point $(-\frac{1}{2}, -\frac{1}{2})$.
As you can see, increasing the probability of an element is similar to increasing its mass.
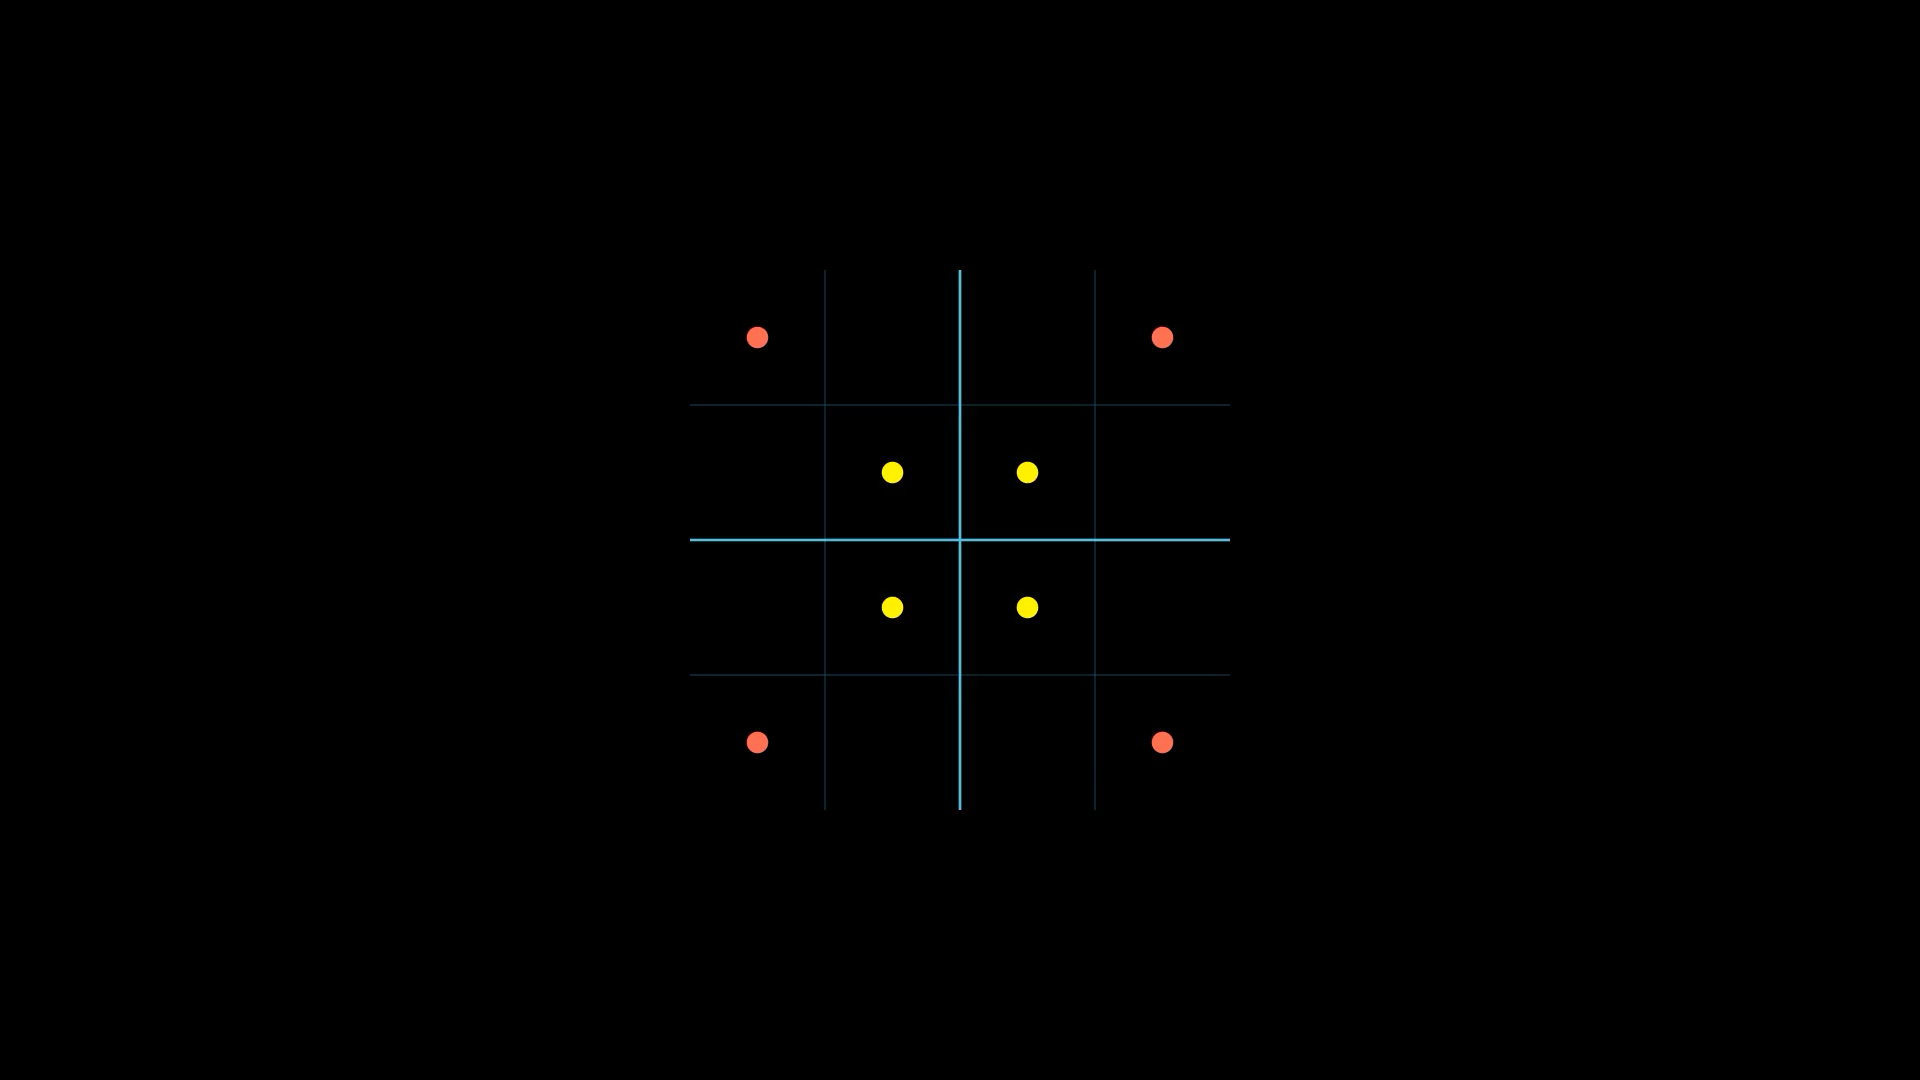
All this is great but check the following data points.

Even though they have the same mean it is clear the yellow dots are closer to their mean than red dots. This observation leads us to an important question: how can we measure this difference in spread when the means are identical?
Variance: Measuring the Spread from Center
At first, one may be tempted to compute the difference of each element to the mean
$$ X - \mathbb{E}[X] $$and then to average it
$$ \mathbb{E}[X - \mathbb{E}[X]] $$However, if you take a fraction of a second to think about it you will quickly realise that is always equals zero.
It’s only logical as the differences will cancel out. One way to fix this would be to take the absolute value of each difference
$$ \mathbb{E}[|X - \mathbb{E}[X]|] $$One of the key things to remember in math is that nobody likes absolute values as they are a pain to work with. You know what is one of the things people like to work with and that achieves the same goal ? Squared values ! This gives us the following formula:
$$ \mathbb{E}[(X - \mathbb{E}[X])^2] $$Another cool thing about squaring is that it emphasizes larger deviations more, making extreme values stand out.
The only downside with variance is that its unit is not the same as our initial one. That is, if $X$ is expressed in meters $m$, $\text{Var}(X)$ will be expressed in meters squared $m^2$ which is harder to visualize.
This is why many like to work with standard deviation.
The standard deviation of a random variable $X$ is defined as:
$$ \begin{align*} \sigma &= \sqrt{\mathbb{E}[(X - \mathbb{E}[X])^2]} \\ &= \sqrt{\text{Var}(X)} \end{align*} $$As said above, taking the square root of the variance is great as it gives us the original unit of measure !
A lot of people also like working with the coefficient of variation defined as :
$$ CV = \frac{\sigma}{\mu} $$This measure is very useful because the standard deviation must always be understood in the context of the mean of the data. Indeed, a standard deviation of $100$$ when you deal with millions of dollars is much more acceptable than when working with tens of dollars.
Awesome, we now have a way to better understand a random variable ! But hear me out: What if… what if we are working with multiple random variables ?
Covariance: Measuring How Two Variables Move Together
We define the covariance between two random variables $X$ and $Y$ as:
$$ \text{cov}(X, Y) = \mathbb{E}[(X - \mathbb{E}[X])(Y - \mathbb{E}[Y])] $$What does this mean ?
Covariance measures the extent to which two random variables vary together. If $X$ and $Y$ tend to increase and decrease together, their covariance is positive. If one tends to increase when the other decreases, their covariance is negative. If there is no discernible pattern, their covariance is close to zero.
Intuition Behind the Formula
As you can see, under the hood this formula is actually the expected value of a third random variable $Z$ defined as:
$$ Z = (X - \mathbb{E}[X])(Y - \mathbb{E}[Y]) $$You might ask why can’t we simply take look at $Z = XY$ and why subtracting their respective expected values is relevant here.
To develop intuition, let’s consider an example:
- Suppose we track the daily temperature $X$ and the number of ice creams sold $Y$ at a beach.
- We suspect that warmer temperatures might lead to higher ice cream sales.
- The question is: Do these variables actually move together?
Why Not Just Use $XY$?
If we only looked at $XY$, we’d face a problem:
- The values of $X$ and $Y$ can be large or small, but without considering their typical (mean) values, we cannot determine their relative movement.
- A large $XY$ does not necessarily mean a strong relationship; it might just mean one variable is large in absolute terms.
- If $X$ and $Y$ are always positive (e.g., temperature and ice cream sales), $XY$ will always be positive, making it misleading as a measure of co-movement.
By subtracting their respective expected values (i.e., taking $Z = (X - \mathbb{E}[X])(Y - \mathbb{E}[Y])$), we normalize these values, ensuring that we measure relative movement rather than absolute magnitudes:
If $Z > 0$, both values are either above or below their respective means.
$\Rightarrow$ They move together.
If $Z < 0$, one is above its mean while the other is below.
$\Rightarrow$ They move oppositely.
The magnitude of $Z$ indicates how strong the relationship is: large deviations imply a strong relationship, small deviations imply a weak one.
By taking the expectation $\mathbb{E}[Z]$, we determine whether these relationships hold on average.
The problem with covariance is that it is not scale-free which means that it is hard to interpret beside whether the variables move together.
To understand this, take a look at the following example:
import numpy as np

height_in_cm = [110, 120, 130, 140, 150, 160, 170, 180, 190, 200]
height_in_m = [1.10, 1.20, 1.30, 1.40, 1.50, 1.60, 1.70, 1.80, 1.90, 2.00]

age = [11, 12, 13, 14, 15, 16, 17, 18, 19, 20]


# Print covariance with two decimals
print(f"Cov(height_in_cm, age) = {np.cov(height_in_cm, age)[0, 1]:.2f}")
print(f"Cov(height_in_m, age) = {np.cov(height_in_m, age)[0, 1]:.2f}")
Cov(height_in_cm, age) = 91.67
Cov(height_in_m, age) = 0.92
See ? We didn’t obtain the same results even though the relationships did not change.
But what if… what if there was a way to make this scale free ?
Well there is and it’s called correlation.

Correlation is defined as:
$$ \text{corr}(X, Y) = \frac{\text{cov}(X, Y)}{\sigma_X\sigma_Y} $$Let’s modify our previous code to compute correlation
print(f"Corr(height_in_cm, age) = {np.corrcoef(height_in_cm, age)[0, 1]:.2f}")
print(f"Corr(height_in_m, age) = {np.corrcoef(height_in_m, age)[0, 1]:.2f}")
Corr(height_in_cm, age) = 1.0
Corr(height_in_m, age) = 1.0
That’s great, we obtained the same value for the same relation even though our units were not the same. Now we have a scale and unit-free metric.
Another very nice thing about correlation is that it is very easy and intuitive to interpret:
- It is between $-1$ and $1$.
- If $\text{corr}(X, Y) > 1$, it means that both variable move in the same direction (e.g., height and weight).
- If $\text{corr}(X, Y) < 1$, it means that both variable move in opposite directions (e.g., temperature and people skiing).
- If $\text{corr}(X, Y) \approx 0$, it means that variable are not linearly correlated (e.g., shoe size and IQ).
Actually, there are different types of correlations. This one is called Pearson correlation and it measures linear correlation between two random variables.
We won’t go into details but the other one you should know of is the Spearman’s Rank correlation. This one is useful as it is a non-parametric correlation and does not assume a specific distribution.
Until now we’ve only discussed about static data. But what happens when data evolves or fluctuates over time? In the world of time-series data, it’s crucial to understand how signals relate to themselves or to each other over time. This is where auto-covariance and cross-covariance come into play.
Auto-Covariance: Measuring Self-Similarity Over Time
Auto-covariance, defined as
$$ \gamma_X(\tau) = \mathbb{E}[(X(t) - \mu)(X(t+\tau)-\mu)] $$measures how a signal correlates with itself at different time lags.
It’s a very interesting measure since it let’s you detect patterns or periodicity as well as persistence of past influences.
Cross-Covariance: Measuring Relationships Between Signals
We also define the cross-covariance, expressed as
$$ C_{XY}(\tau) = \mathbb{E}[(X(t) - \mu_X)(Y(t+\tau)-\mu_Y)] $$which measures the dependency between $X(t)$ and $Y(t+\tau)$ across time.
This one is also very handy as it helps you understand how two signals move together over time.
Everything we have seen so far are useful tools to understand random variables. However, up until now, we have implicitly assumed that we have access to the full population distribution, meaning we know all possible values and their probabilities. In reality, we rarely have full knowledge of this distribution. Instead, we work with a sample, which is a subset of the population. This introduces variability, uncertainty, and therefore the need for some new techniques.